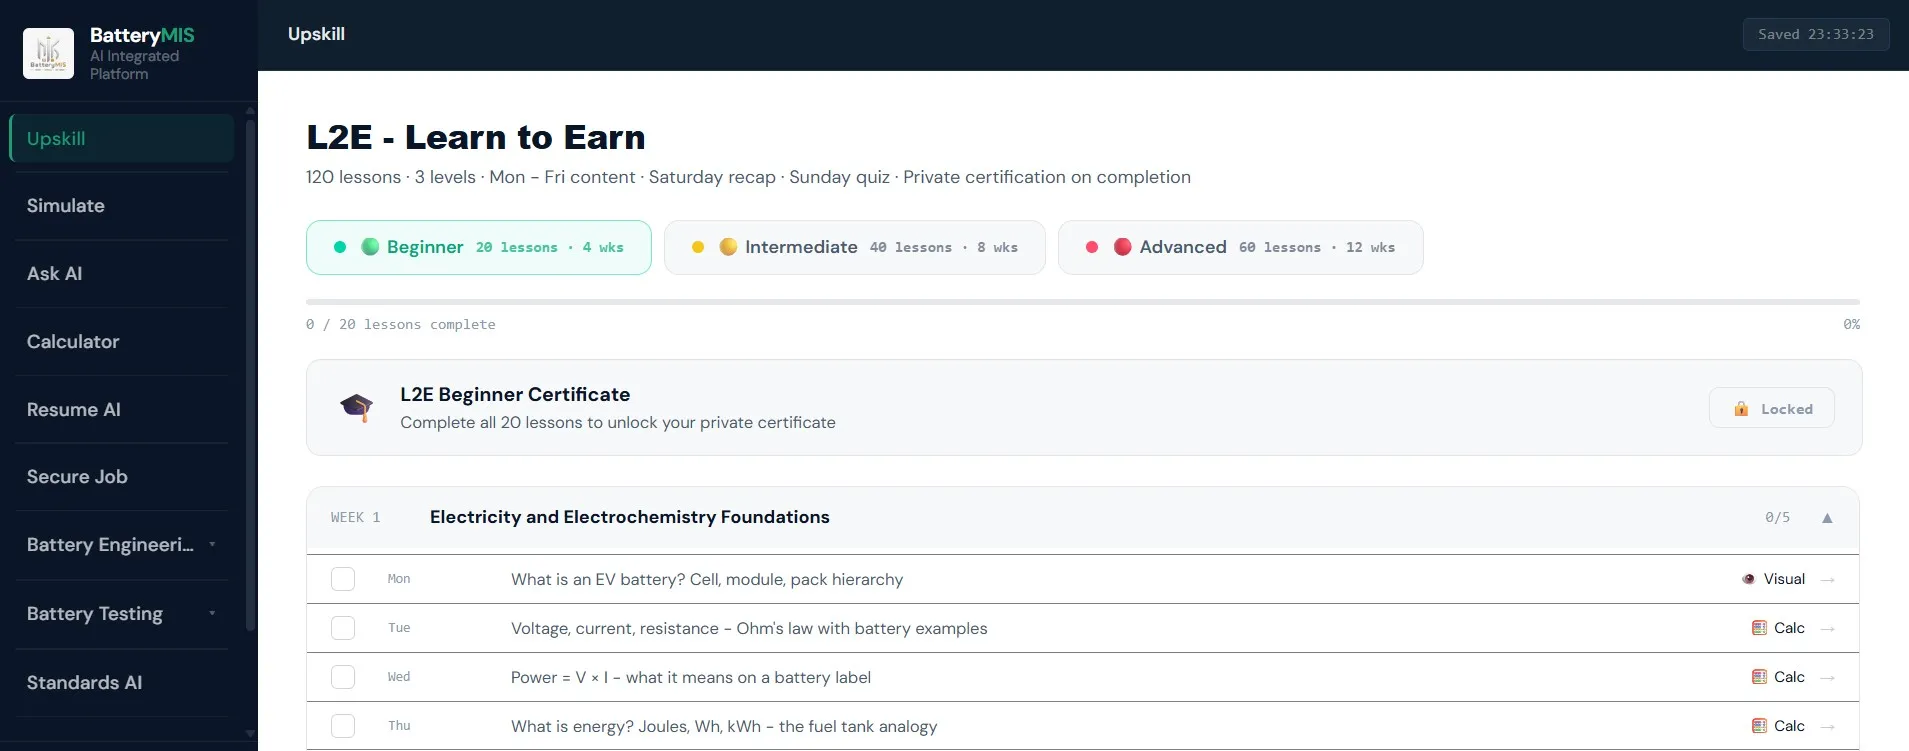
From zero to job-ready
with a structured 160-lesson path.
A purposeful 3-level curriculum: Beginner (40 lessons, 8 weeks), Intermediate (50 lessons, 10 weeks) and Advanced (70 lessons, 14 weeks). Mon-Fri lessons, Saturday recap, Sunday quiz, every week, every level.
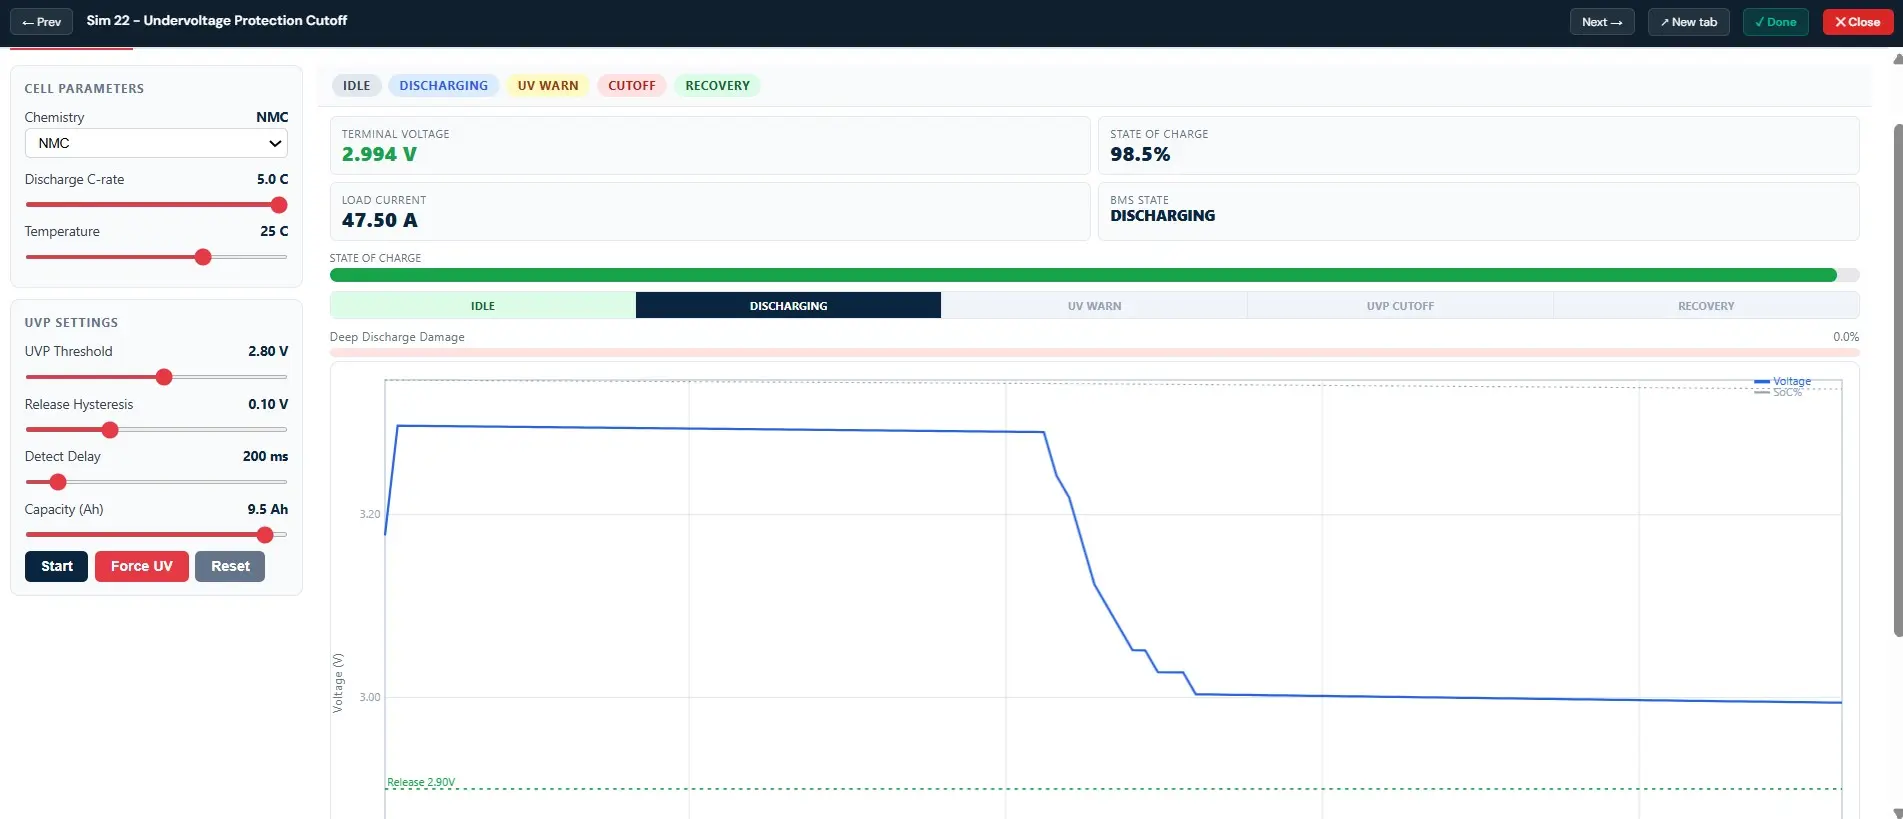
Don't just read it.
See it work. Then know it.
110 interactive simulations - not engineering production tools, but visual classrooms. Drag a slider, change a chemistry, watch the BMS state machine fire. Build the gut intuition that textbooks and lectures cannot give.
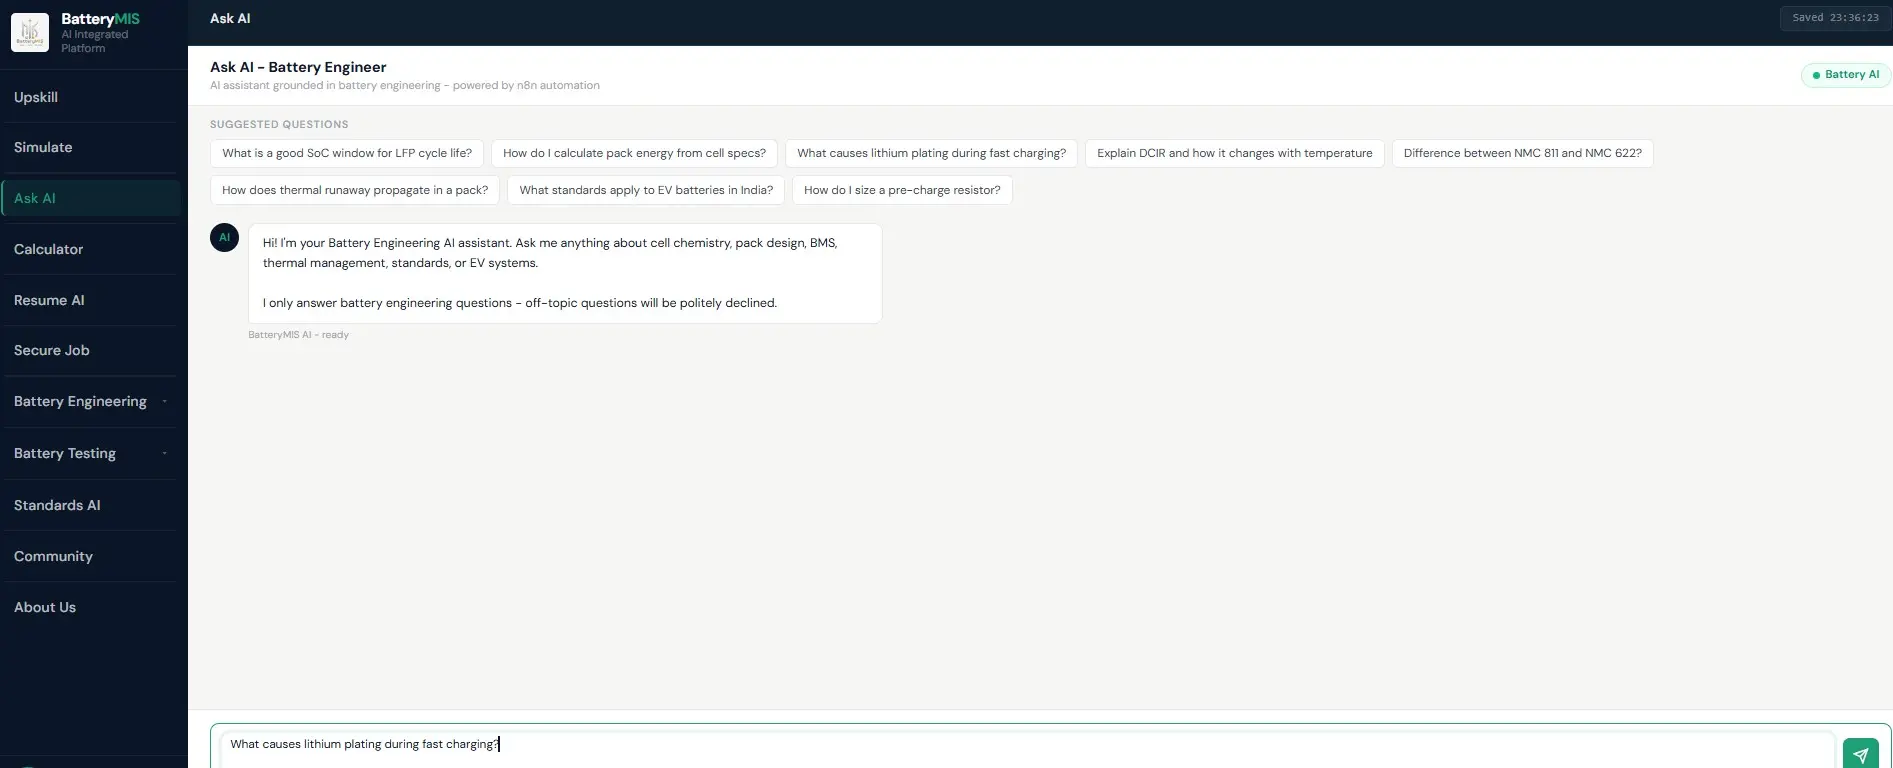
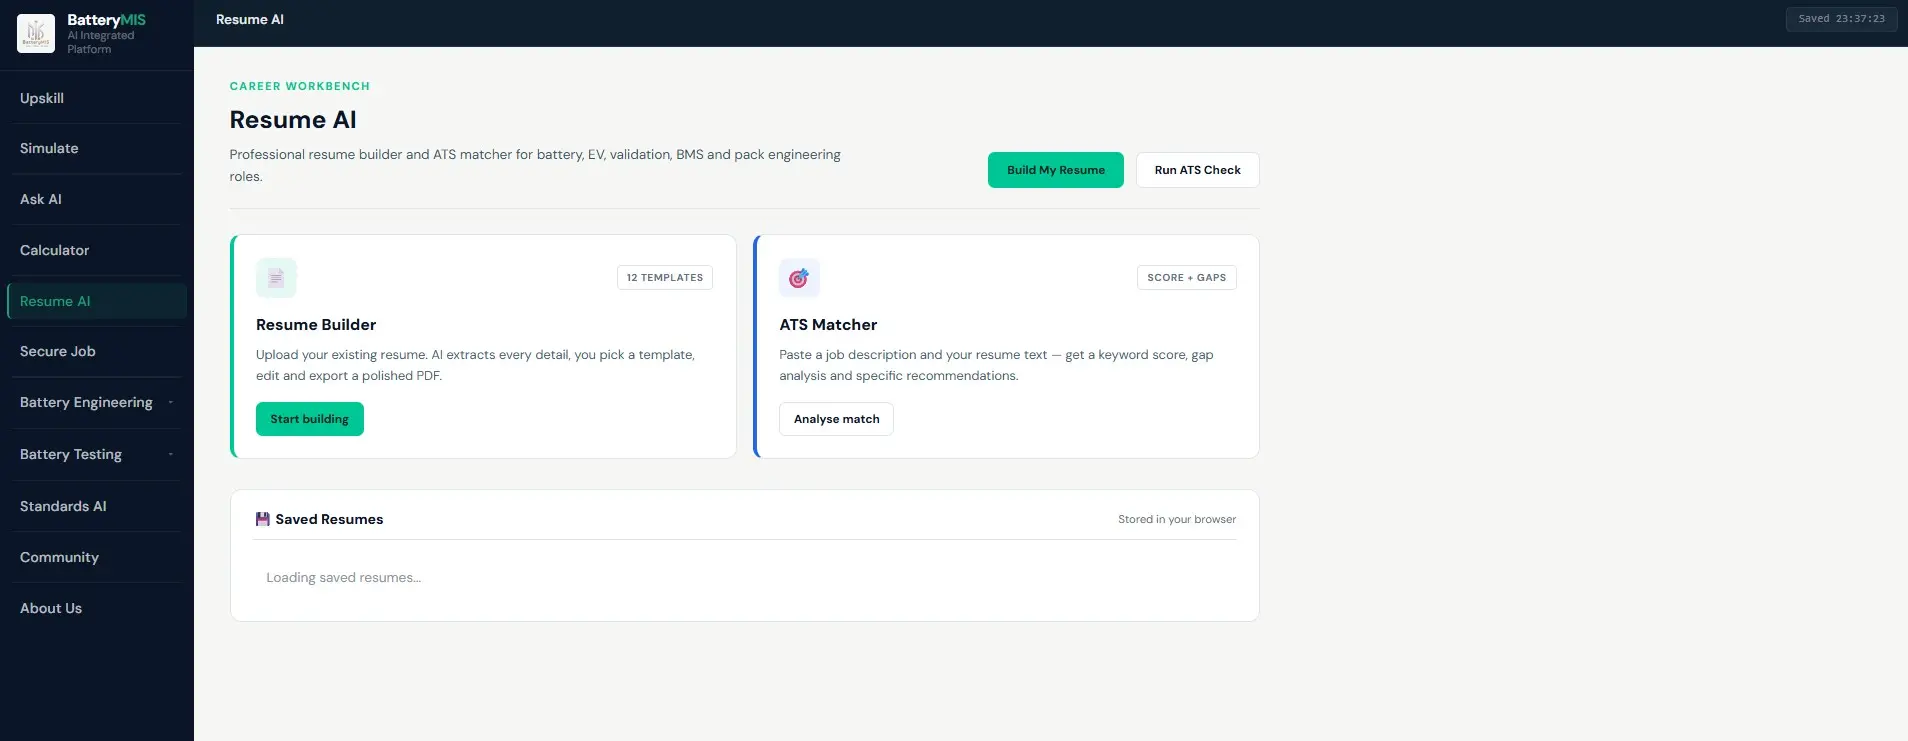
Beat the ATS scan.
Land the battery interview.
Resume AI maps your background to 14 specific battery roles - Cell Test, BMS Validation, Thermal, Pack Design, BESS. Then Secure Job drills you with 150+ visual interview Q&A - easy, medium, advanced. No generic "tell me about yourself" - real battery questions, real engineering answers.
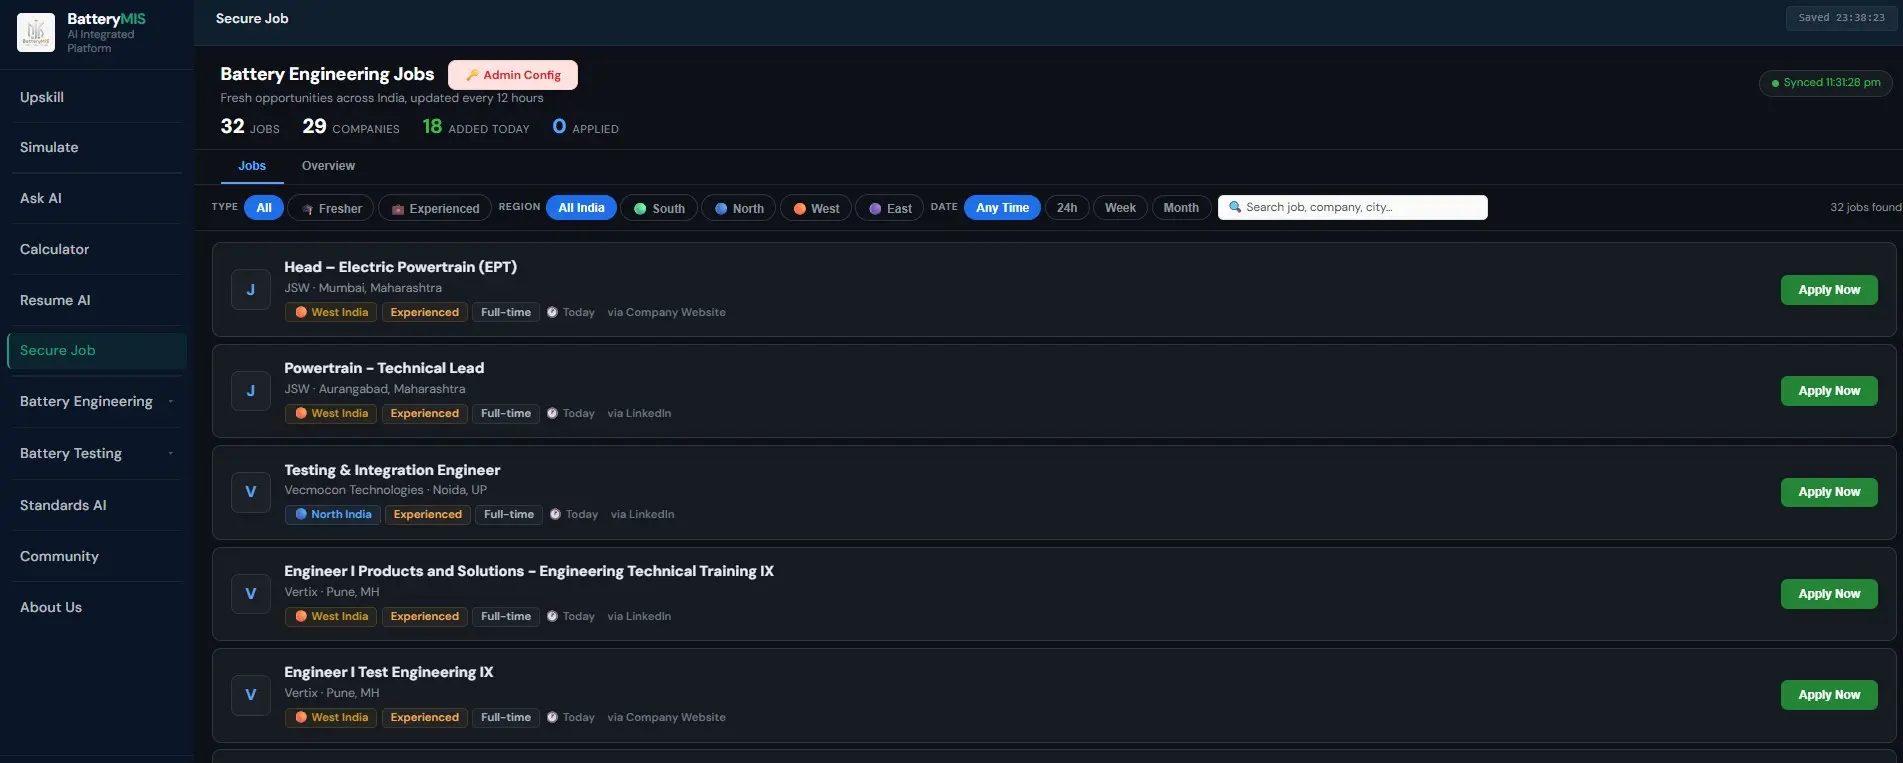
Battery jobs only.
Updated every 12 hours.
No noise. No backend dev. No data analyst. Only EV, battery, BMS, testing, validation, thermal, and BESS roles - pulled fresh from company sites across India twice a day. Top community members get featured to HR partners directly.